Recently I was working with a client that had developed several Azure based micro-services intended to run as an HTTP triggered process, running asynchronously from the client's perspective. In other words, each pass through the system started with an HTTP request, for which the payload was then passed through a series of micro-services utilizing a combination of service buses and storage queues. It looks something like this:
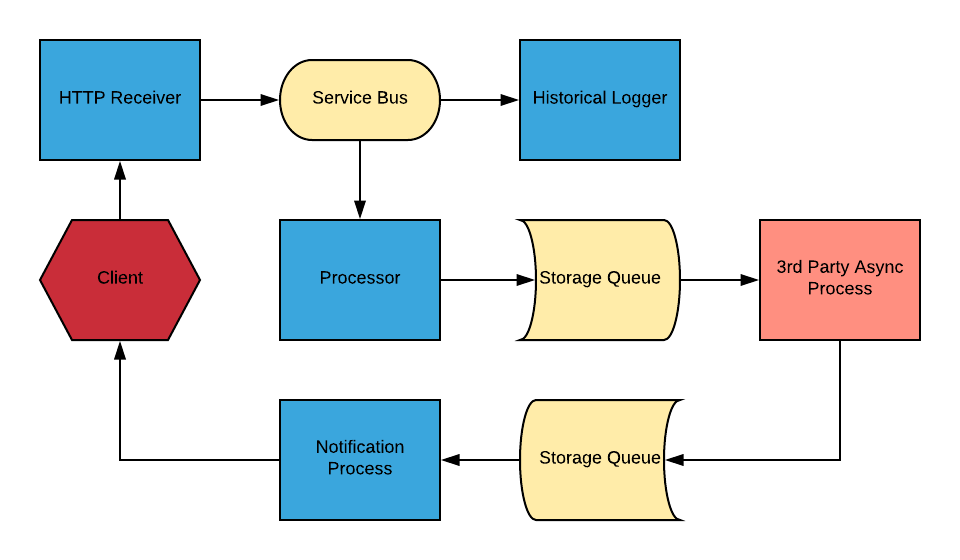
The details are not terribly important - just note that each of the blue boxes in this diagram represents a separate Azure hosted ASP.NET WebAPI or Azure Function based micro-service. Because these were all separate components communicating via service bus and storage queues, plus one black box 3rd party system, message loss and round trip request duration was difficult to track and build into an easily consumable dashboard.
To address this problem, a solution was developed utilizing a combination of custom telemetry events logged by each system component and Application Insights queries .
Creating Telemetry Events
Let's start with the telemetry events. The goal here is to provide Application Insights with events at each step in the system, tagged with a request identifier value. The TelemetryClient included in the Application Insights package published by Microsoft makes this pretty easy.
First, add the Microsoft.ApplicationInsights
NuGet package to the project you want to track events from. You can do this either via the Manage Nuget Packages
interface, or via the Package Console using Install-Package
Microsoft.ApplicationInsights.
Next, we need to create a telemetry client. To do this, we need an instrumentation key, which Application Insights utilizes to route telemetry to the correct instance. In this case, we are relying on the APPINSIGHTS_INSTRUMENTATIONKEY app setting, which gets set automatically by azure when you enable Application Insights for a function application.
using Microsoft.ApplicationInsights;
using Microsoft.ApplicationInsights.Extensibility;

TelemetryClient telemetryClient = new TelemetryClient(
    new TelemetryConfiguration
    {
        InstrumentationKey = ConfigurationManager.AppSettings["APPINSIGHTS_INSTRUMENTATIONKEY"]
    }
);
Finally, we can add the telemetry event by creating a TelemetryEvent object and using our client to track it. The trick here is to set the context operation_Id to a value that each component in our system will have access to, so that we can correlate the events on that value.
var trackingEvent = new EventTelemetry("Intake");
trackingEvent.Context.Operation.Id = requestId;
_telemetryClient.TrackEvent(trackingEvent);
The same two code segments can be used in each component in the system. At a minimum, to track request completion, events will need to be added for the initial intake component (typically an API or HTTP triggered Azure function) and the final component in the system (typically a response notification method). The only thing that needs to change is the "EventName" string, which should be unique for each location you'd like to track.
Reporting
With telemetry events being provided to Application Insights, we have the data we need to track the two metrics we care about:
- How long it takes a request to make it from intake through the final component of the system (Request Duration).
- How many, if any, requests fail to make it all the way through the system (Failed Requests).
The first step for both of these metrics is to generate a list of requests taken in (with a corresponding timestamp), joined together (by operation id) with the corresponding final step events. For our purposes, we will assume the relevant events are named "Intake" and "Complete".
// Capture some variables; this is primarily to aid re-use / configuration
let startEvent = "Intake";
let completeEvent = "Complete";
let eventsData = customEvents; // This can be used to enable cross AI instance reporting.
let granularity = time(1m);
let rangeStart = bin(ago(24h), granularity);
let rangeEnd = bin(now(), granularity);
eventsData
| where name == startEvent and timestamp between (rangeStart..rangeEnd)
| project start = timestamp, operation_Id
| join kind=leftouter
(
    eventsData
    | where name == completeEvent
    | project complete = timestamp, operation_Id
)
on operation_Id
Most of this should be pretty straightforward if you've played around with Application Insights before. The one thing worth calling out is the use of the eventsData variable. Because Azure apps are frequently split across regions, and Application Insights instances can be included in that split, it is sometimes useful to query multiple instances. To do this, you can union multiple customEvents tables like so*:
let eventsData = app('east-ai-instance').customEvents | union app('west-ai-instance').customEventsThe end result of this query is a table with four columns:
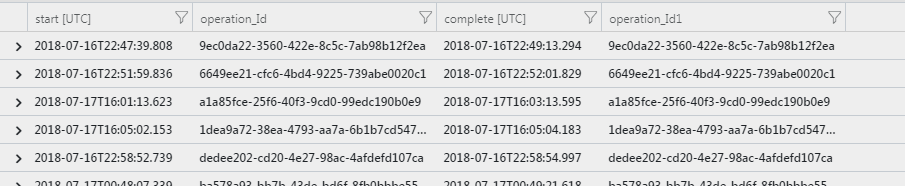
Using this data set as a base, we can filter and project the events into the two data points we care about.
Duration
Producing the duration dataset requires minimal changes to the base query; simply add two clauses:
| where isnull(complete) == false
| project start, duration = (complete - start)/time(1s)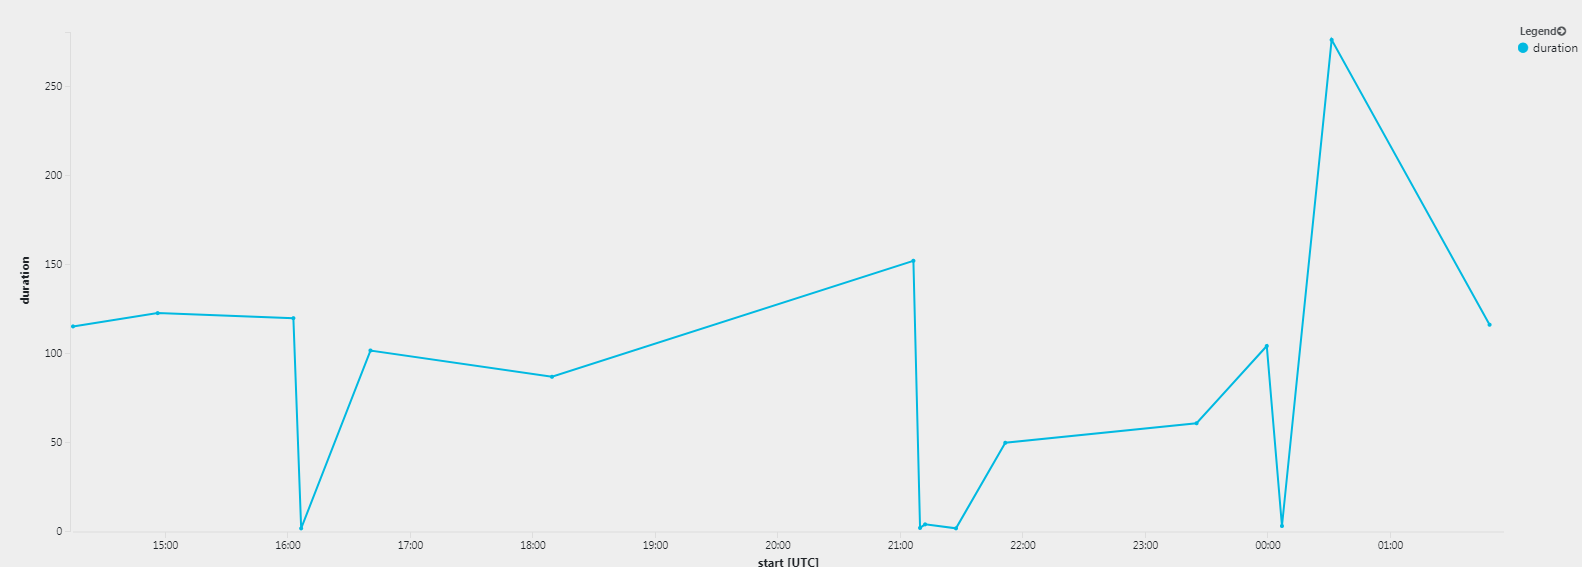
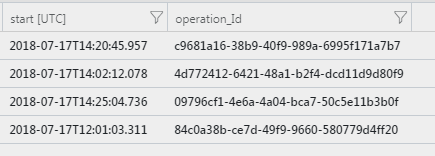
Failed Requests
Producing the failed request data set is even easier, because we don't have to do any calculations in the projection. Simply filter out the records with completion events (and those started within the last 5 minutes) and project the start and operation_Id as follows:
| where isnull(complete) and start < ago(5m)
| project start, operation_Id
With those additions, we can generate a table of failed requests, with corresponding request IDs.
There is an advanced version of this that can be turned into a chart for dashboards as well. If you'd like to learn more about that, or about custom charts on dashboards in general, check back soon as I'll be covering that topic next -or just following me on Twitter @sysgineer to be notified of all my upcoming articles. In the mean time, feel free to pull down the example app and let me know if you have questions!
* For more information, see this article from Microsoft.